I’ve been doing more programming than usual recently, both at work writing scripts for managing video media, and at home working on the Mixxx DJ software. It seems 90% of my time is spent debugging, and the more difficult a bug is the more I find myself falling into an unproductive death spiral: try to fix the problem by tweaking a little code, recompile, test, fail, repeat. I’ll think that if I just change this one variable, or move this one bit code I’ll be done, but no it’s still broken and two hours later I’ve gotten nowhere. I keep having to relearn the same lesson: you can’t debug well if you don’t have good information.
Often my first stabs at debugging involves sprinkling print statements around my programs ((This article might be rendered entirely irrelevant if you work the Right Way, using debugging interfaces, stepping through code, and looking at live backtraces. But I suspect a lot of people start with print statements)). For simple problems this can actually work well, but as bugs get more tricky and complicated trying to analyze all that screen barf of can be difficult and a huge waste of time. It’s important to recognize when you’re not getting anywhere.
One problem I’ve been working on is the audio processing in Mixxx. When a DJ is using turntables to play music, and especially when they are scratching, the music changes speed radically, often in a tiny fraction of a second. The music will speed up, slow down, and reverse direction. The playback code has to mimic this bending, stretching, and warping that happens on an actual record player. If there are any errors in the math, it will cause ugly and unacceptable pops and clicks in the playback.
The old Mixxx code had a lot of clicks, buzzes, and pops. Certain playback speeds would cause noise, scratching would cause loud snaps, slow speeds caused rapid popping. I wasted several days trying to analyze those clicks by looking at printouts of variables, and only after I got to the point of complete frustration did I take a step back and think about how to attack the problem better.
I had been testing my code with actual music, and that was difficult because actual music often looks random up close — it’s hard to discern where the errors are in all that noise. So step one was to analyze data for the simplest possible case: a sine wave. Any errors would show up as large deviations from the smooth wave. This is a basic first step in making debugging easier: create a simple test-case. If you’re working on a huge data set, or a giant calculation, or a massive document, pare it down to the bare essentials necessary to reproduce the bug.
But even using a sine wave I couldn’t figure out what was going on. With 44,100 samples per second, there was too much data to analyze based on printed-out numbers. I recalled a bit in Michael Crichton’s “Terminal Man” ((This is why Google Books is a good idea)) that explains the problem:
“People,” Gerhard said, in mock irritation. “They just can’t handle machine data.” It was true. Machines could handle column after column of numbers. People needed to see patterns.
The book then proceeds to show both a list of numbers and a graph — the difference in readability is immediately apparent.
With some help from my dad and brother, both of whom often need to plot data, I was able to write a small script to display my debugging information:

This was a major breakthrough: find the best way to visualize your variables. I’m working with audio data, so a plot is a good choice. It took me a whole day just to adapt my program to write the audio data to a file and to write a new program to display that data, but once I was done the errors showed up as obvious spikes in the graphs. Moreover, by the shape of the waves I could get an idea of why certain clicks were happening: an off-by-one error here, a rounding error there, etc.
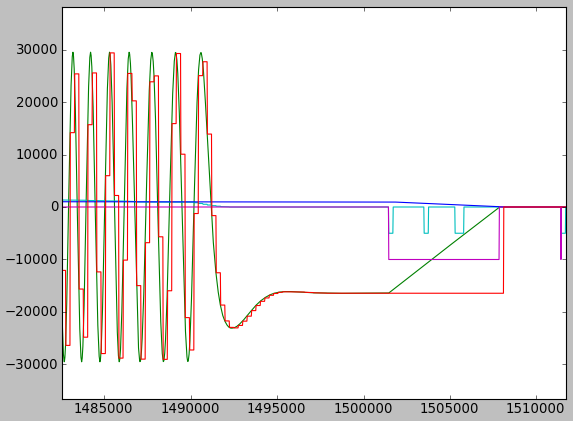
The graph above shows several variables: the actual generated sound wave (green), a reference sample (red), playback speed (cyan) ((except that when playback speed is zero, I set it to -5000 so I can see it clearly)), and some other internal variables. If I see a spike I can look at the other lines and figure out where to start looking for a problem — the rate going from negative to positive (a record scratch), perhaps. The output above is correct — a smooth curve that is gradually brought back to zero when the turntable stops. (OK so that linear part at the end is not ideal, it should really be a curve — but otherwise it’s good.)
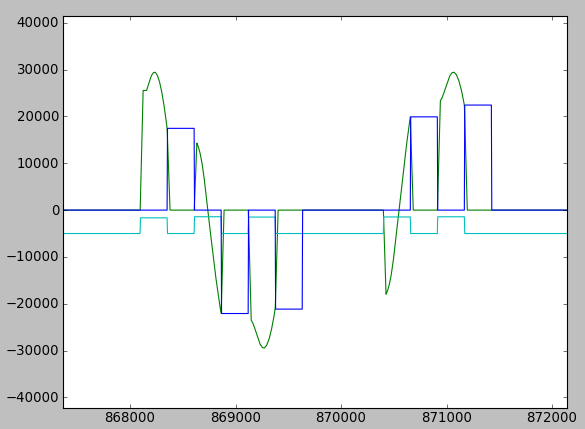
This is what the old, incorrect code looks like by the way. Notice the obvious errors in the graph, how the green line jumps up and down suddenly:

This method debugging could still be improved. I need to get up and scratch the turntable manually to generate data. Time spent triggering a bug is wasted. Every second you’re clicking around is time not spend debugging, which is why you need to make testing quick and easy. A bad test case is one that requires you click some options, open a file, manipulate some UI elements, and then eventually trigger the bug. An ideal test case would be a single command or button in the UI that performs a test. This keeps your mind focused on the bug, not on the boring, repetitive actions needed to trigger the bug.
Debugging is already a slow, painful process, and the prospect of writing extra code and programs just to debug your code can feel like superfluous work. But time spent writing good test cases and analyzation tools will more than pay itself back. Not only will you solve a bug more quickly, you may not have been able to solve the bug otherwise. It’s hard to get out of the tweak, recompile, test, repeat cycle, but you won’t get unstuck until you make your job easier:
- Recognize when you’re not getting anywhere
- Create a simple test-case
- Find the best way to visualize your variables
- Make testing quick and easy
With my Mixxx work, I still haven’t made testing quick and easy. I should probably write an internal test-case that loads the sine wave and performs a few basic scratches automatically. But even doing only two out of three of the steps got me out of the debugging death spiral.
